Superluminal Performance 1.0.7708.1297 x64是Windows平台的高性能低开销CPU性能分析器,支持C++、Rust、C#等语言,无需代码插桩即可高频率分析,适合游戏开发与高性能计算场景。
原始标题:Superluminal Performance 1.0.7708.1297 x64
Superluminal Performance 是一款专为 Windows 平台打造的高性能、低开销、可视化 CPU 性能分析器(Profiler)。它以极高的频率分析运行在 C++、Rust、C# (.NET) 等语言编写的应用程序,特别适合游戏开发、高性能计算等对运行效率要求极高的场景。
File size: 76.8 MB
Profiling, Re-Invented. The new industry standard profiling tool. Do you use instrumentation or sampling? Why compromise? Superluminal brings you the best of both in one seamless experience.
Zero integration time
Hit the ground running. No need for intrusive markup of your code.
Graphical Interface
Best-in-class visualizations let you explore and recognize performance problems with minimal effort.
Unbiased Profiling
Annotating your code means bias towards where you think the problem is, instead we show you where it really is.
Provides Context
Get the big picture by going beyond the bare statistics. Understand why, when and in what order your code is executing.
Kernel Level Stacks
See what really happens under the hood when you perform that system call. It’s like having X-ray vision.
Precision
Unprecedented precision through our high frequency sampling engine (8KHz+). When needed, add even more precision through use of our API.
Superluminal is great. We mostly use it to profile long-running processes and thread interactions (think: servers, content conversion, offline rendering). Its UI is really simple and quickly allows you to go from overview, thread interactions, PC samples, to source and disassembly. We fixed many performance issues, including ones we didn’t even know we had.
Visual UI
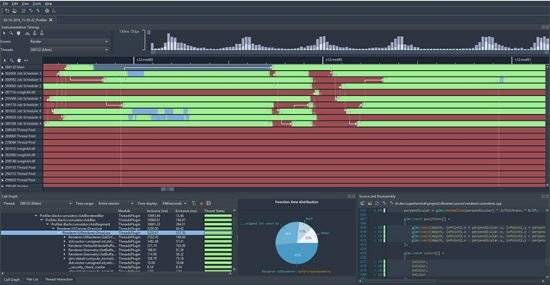
Superluminal is the only sampling profiler that displays the profiling data in a visual UI. Sampling data is displayed on a per-thread timeline, which allows you to see exactly what function is being called when, in what order, and what other functions are being called around it.
Multithreading Analysis
Understanding the complex interactions between threads in a program can be key in resolving performance issues. These complex interactions are visualized in an intuitive interactive interface that allows you to inspect blocking and unblocking callstacks and easily navigate between them.
High Frequency Sampling
High frequency sampling (8 – 40 kHz, depending on platform) allows you to hit the ground running without the need to make any code modifications. Sampling can start right from the start of the application, allowing you to inspect application startup, including DLL loading, the static initialization phase and more.
Source & Disassembly
The source window displays source code along with per line timing and thread state information. To drill down even deeper, a mixed-mode disassembly view lets you view per-instruction timing information. If no source code is available, the disassembly is displayed.
Filtering
Superluminal is capable of isolating a specific portion of a capture. Investigate unexpected frame spikes, or zoom in to the startup phase of your application.
此处内容需要权限查看
会员免费查看1、VIP会员仅需30元全站资源免费下载!
2、资源默认为百度网盘链接,请用浏览器打开输入提取码不要有多余空格,如无法获取 请联系微信 yunqiaonet 补发。
3、分卷压缩包资源 需全部下载后解压第一个压缩包即可,下载过程不要强制中断 建议用winrar解压或360解压缩软件解压!
4、云桥CG资源站所发布资源仅供用户自学自用,用户需以学习为目的,按需下载,严禁批量采集搬运共享资源等行为,望知悉!!!
5、云桥CG资源站,感谢您的赞赏与支持!平台所收取打赏费用仅作为平台服务器租赁及人员维护资金 费用不为素材本身费用,望理解知悉!平台资源仅供用户学习观摩使用 请下载24小时内自行删除 如需商用请支持原版作者!请知悉并遵守!
6、For international users: If you do not have a Baidu Netdisk VIP account, please contact WeChat: yunqiaonet for assistance with logging into Baidu Netdisk to download resources..